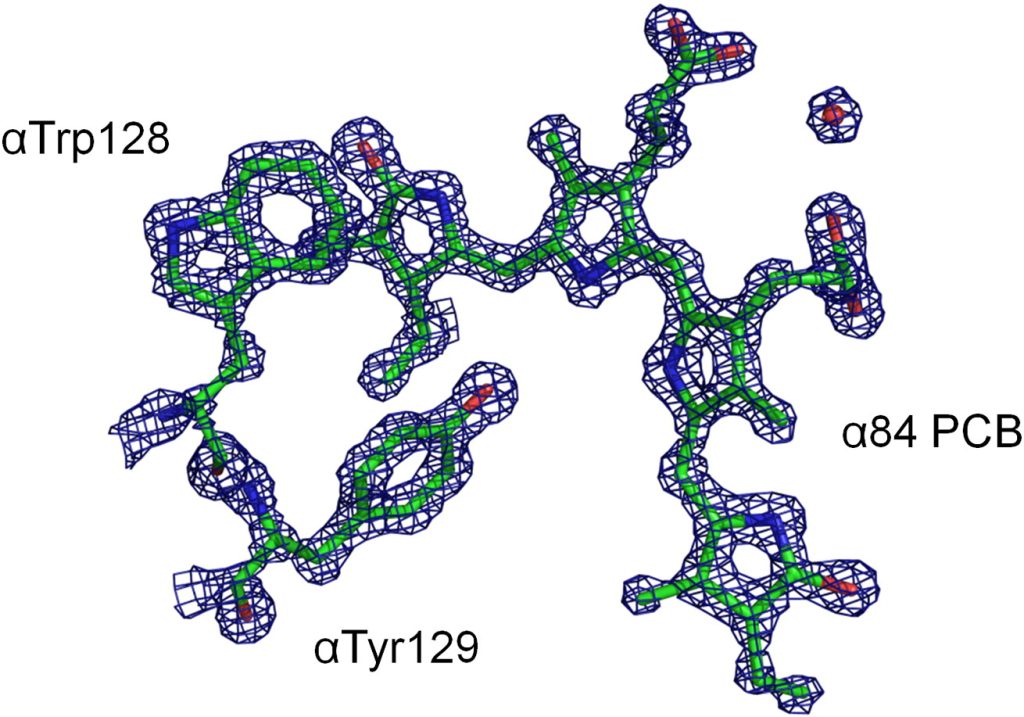
Fig. 1. Quality of the high-resolution Tv-PC structure. A section of a 2Fo − Fc omit electron density map was contoured at 3 σ on the α84 phycocyanobilin cofactor and nearby residues αTrp128 and αTyr129. Residues are shown in stick representation with C, N, and O atoms colored green, blue, and red, respectively.
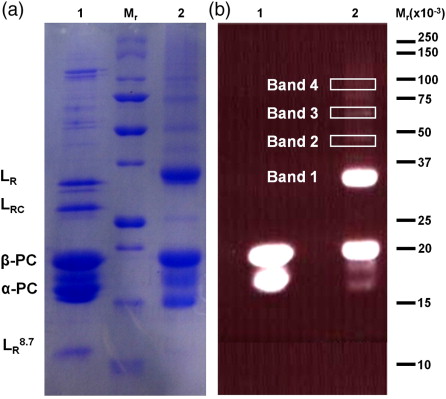
Fig. 2. SDS-PAGE analysis of isolated rods. Lanes 1 and 2, isolated rod fraction components prior to and following cross-linking with GA, respectively. (a) PBPs visualized by Coomassie brilliant blue stain. (b) PBPs visualized by intrinsic fluorescence under UV illumination. Mr, molecular weight marker (Precision Plus Protein, Bio-Rad).